

 Vet Recommended
  Voted #1 by Top Trainers & K9 Units
  Made in USA
  Third-Party Tested
 Did Fresh Food Make Dogs One Year Younger? Negative, Ghost Rider.

There's more to the story.
There’s a new study circulating on social media with some interesting clickbait headlines claiming that dogs switching from kibble to fresh food “became biologically one year younger in just six months.”
While that is a SUPER impressive claim, it is not what this pilot study showed (not even close).
So, let’s go through the methods and results to clarify what the researchers actually found.
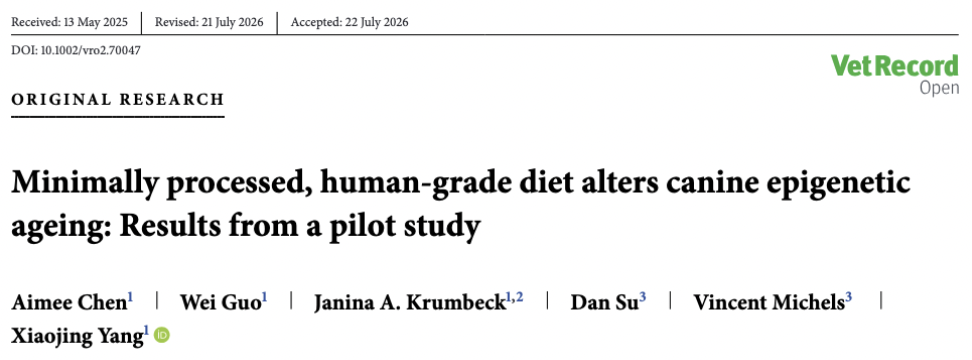
Chen et al. (2026) first developed a proprietary epigenetic clock using DNA collected from canine cheek swabs. An epigenetic clock uses patterns of DNA methylation via chemical markers attached to DNA to estimate age. The model was trained using 37 dogs and then tested in 67 different dogs by comparing their predicted epigenetic age, called “DNAge,” with their known chronological age (see Figure 1).
Figure 1 via Chen, A., Guo, W., Krumbeck, J. A., Su, D., Michels, V., & Yang, X. (2026). Minimally processed, human-grade diet alters canine epigenetic ageing: Results from a pilot study. Veterinary record open, 13(2), e70047. https://doi.org/10.1002/vro2.70047
How to read Figure 1: Each dot represents one dog. The closer the dots fall to the diagonal line, the more closely the clock’s prediction matches the dog’s actual age. The correlation was nearly perfect in the dogs used to build the model (r = 0.99) but (as expected) weaker when tested in different dogs (r = 0.83).
What does an r-value mean? An r-value describes the direction and strength of the relationship between two variables (aka the correlation). Values range from −1 to 0 and from 0 to +1. Values closer to either −1 or +1 represent stronger relationships (e.g., r = 0.987), while values closer to zero represent weaker relationships (e.g., r = 0.123). A positive value means that the variables generally increase together, whereas a negative value means that as one variable increases, the other generally decreases (e.g., r = −0.456) (aka the variables are inversely related).
What it does not mean: This figure suggests that the clock can estimate a dog’s chronological age. It DOES NOT establish that short-term changes in its score represent changes in health, disease risk, lifespan, or the actual speed of biological aging. The figure also labels the testing result as r = 0.83, while the text describes 0.83 as a “coefficient of determination.” Those are not interchangeable.
The researchers then enrolled 38 pugs that were already eating commercial dry food. Nineteen remained on their existing kibble, while 19 were assigned a cooked, minimally processed diet. After six months, 18 fresh-fed dogs completed the study, but only seven kibble-fed dogs remained. That represents approximately 5% attrition in one group versus 63% in the other, creating a SERIOUS risk of selection bias.
The primary outcome was “delta age,” meaning the difference between a dog’s predicted epigenetic age and actual chronological age. As you see in Figure 2, in the fresh-food group (right side), mean delta age decreased from 2.75 to 1.80 years (p = 0.02). In the kibble group (left side), it decreased from 2.77 to 2.46 years, but the change was not statistically significant (p = 0.86).
Figure 2 via Chen, A., Guo, W., Krumbeck, J. A., Su, D., Michels, V., & Yang, X. (2026). Minimally processed, human-grade diet alters canine epigenetic ageing: Results from a pilot study. Veterinary record open, 13(2), e70047. https://doi.org/10.1002/vro2.70047
How to read Figure 2: Each blue point represents one dog, and each dotted line connects that dog’s baseline and six-month measurements. Downward lines indicate decreased delta age; upward lines indicate increased delta age. Notice the considerable individual variation and major imbalance between the seven kibble-fed dogs and 18 fresh-fed dogs.
What does a p-value mean? A p-value tells us how unusual the observed results would be if there were truly no effect or difference. Smaller values provide stronger evidence against that “no-effect” explanation. For example, p = 0.023 means this result would occur approximately 2.3% of the time under the no-effect model. Being 0.023 is below the commonly used cutoff of 0.05, the result is considered statistically significant. Conversely, p = 0.230 is NOT statistically significant because it exceeds 0.05 and does not provide sufficient evidence against the no-effect explanation. Importantly, a p-value does not tell us how large, important, or clinically meaningful an effect is, and a nonsignificant result does not prove that no effect exists. In simple terms: we are generally looking for p ≤ 0.05, but statistical significance is only one part of interpreting a result. Bigger p-values = less evidence against no effect. No bueno.
There is also a VERY critical statistical problem in this paper: a significant change in one group and a nonsignificant change in another DOES NOT prove that the groups responded differently. According to the supplementary data provided, 13/18 fresh-fed dogs (72.2%) and 4/7 kibble-fed dogs (57.1%) were classified as “younger.” However, the direct comparison between groups was not statistically significant (odds ratio = 1.90, 95% confidence interval = 0.28 to infinity, p = 0.39). In other words, this study DID NOT demonstrate that the fresh-food group experienced a greater response than the kibble group.
The supplementary output also reveals that this was a one-sided test, meaning the analysis specifically tested whether fresh food performed better, rather than simply whether the groups differed. The female-only analyses were also one-sided. Unless that directional approach was selected BEFORE examining the results, it warrants additional caution because one-sided tests make statistical significance easier to reach (thus, the term p-fishing). Let’s also note that Figure 2 reports p = 0.688 for the kibble group, whereas the written Results report p = 0.86. Neither is significant, but the unexplained discrepancy should have been corrected, and it wasn’t.
? Raise your red flags ?
The “one year younger” claim is also misleading. Delta age decreased by 0.95 years, but the dogs simultaneously became approximately 0.5 chronological years older. Therefore, the reported values imply an average decrease in predicted epigenetic age of approximately 0.45 years (that’s not even close to one year!). More importantly, a change in this experimental clock estimate DOES NOT demonstrate that the dogs reversed physical aging, became healthier, or gained additional lifespan. Come on now.
Moving on to Figure 3, the researchers also examined DNA methylation at the KISS1R gene, which has previously been associated with canine obesity. KISS1R methylation decreased significantly within the fresh-food group (p = 0.01) but not within the kibble group (p = 0.578).
Figure 3 via Chen, A., Guo, W., Krumbeck, J. A., Su, D., Michels, V., & Yang, X. (2026). Minimally processed, human-grade diet alters canine epigenetic ageing: Results from a pilot study. Veterinary record open, 13(2), e70047. https://doi.org/10.1002/vro2.70047
How to read Figure 3: The dotted lines show each dog’s change in KISS1R methylation. Individual responses moved in both directions. Once again, “significant here but not significant there” does not demonstrate that the diets produced different effects. The paper does not report a clear direct diet-by-time comparison showing that KISS1R methylation changed more with fresh food than with kibble.
The investigators then examined whether males and females responded differently within the fresh-food group. Guess what? They did not demonstrate a sex difference. Although females had a somewhat larger average reduction in delta age, the difference was not statistically significant (p = 0.46)(see Figure 4).

Figure 4 via Chen, A., Guo, W., Krumbeck, J. A., Su, D., Michels, V., & Yang, X. (2026). Minimally processed, human-grade diet alters canine epigenetic ageing: Results from a pilot study. Veterinary record open, 13(2), e70047. https://doi.org/10.1002/vro2.70047
How to read Figure 4: Negative values represent reductions in delta age. The females appear to have a somewhat larger median reduction, but the distributions overlap substantially. Importantly, this figure includes only fresh-fed dogs, so it cannot determine whether sex altered the comparative effect of fresh food versus kibble.
Let’s also remember that this was a small, industry-funded pilot involving one small breed, severe and highly unequal attrition, multiple different kibble diets, owner-reported weights, one-sided statistical tests, and a proprietary clock developed by company-employed investigators. JustFoodForDogs funded the study, supplied the intervention food, and employed two authors. Several other authors worked for Zymo Research, the company that developed the proprietary DNAge clock. These relationships do not automatically invalidate the findings, BUT they make transparent methods and independent replication especially important.
I’d also like to give the authors some credit for acknowledging several general pilot-study limitations and usually used cautious terms such as “may” and “preliminary.” However, the title, discussion, and conclusions still overstate what the statistical comparisons demonstrated. Social media then removed the remaining caution and transformed an inconclusive pilot finding into the unsupported claim that fresh food made dogs one year younger.
The appropriate conclusion is modest at best: fresh-fed pugs experienced a within-group change in an experimental epigenetic measure. However, the study DID NOT establish nor “prove” that fresh food makes dogs one year younger, that kibble accelerates aging, or that either diet changes canine healthspan or lifespan.
Be careful what you read and who you trust on the internet, and always make sure to read the full study for yourself.
Reference
Chen, A., Guo, W., Krumbeck, J. A., Su, D., Michels, V., & Yang, X. (2026). Minimally processed, human-grade diet alters canine epigenetic ageing: Results from a pilot study. Veterinary record open, 13(2), e70047. https://doi.org/10.1002/vro2.70047